|
I have begun tracking a much wider array of statistics on Coronavirus and will be updating the blog more frequently, but here are some numbers out of Metro-Detroit which turns out to be one of the hotspots for COVID cases and deaths sadly. In future blogs, I hope to integrate data from FlightRadar24 which shows how many flights are still coming into Metro-Detroit from all over the world. In this post, I calculate the most recent statistics for Metro-Detroit. Here we see the number of confirmed cases by County. 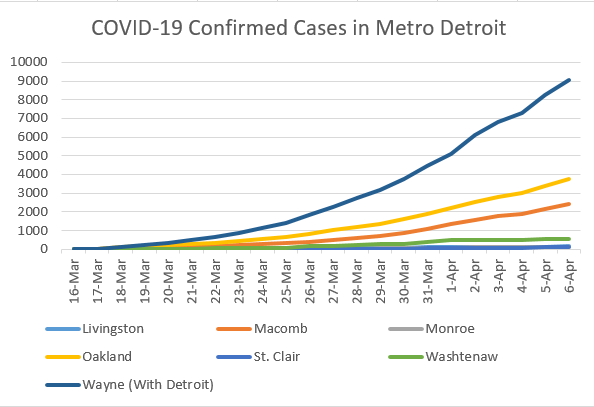 The problem with this of course is that the raw number does not tell us anything about the population size, so I standardize by population. The next visual shows the cases in per capita terms. I notice that the number of cases in per capita terms is still a fraction of 1% of the population. 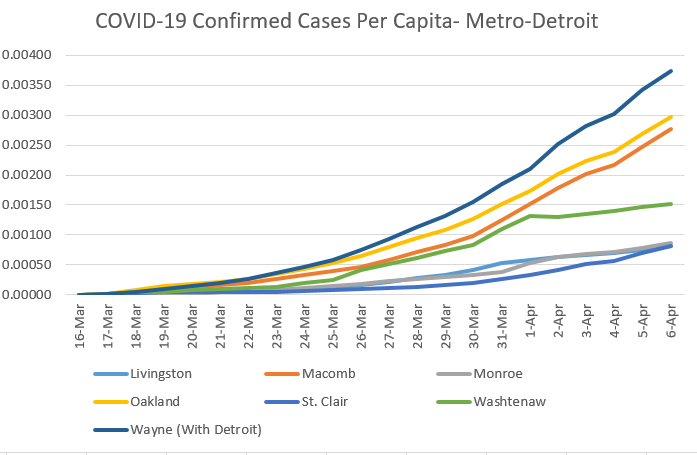 We are of course worried about the fatality rate. So, I look at the percentage of confirmed cases that result in death. But, I am interested in seeing the relationship with population density. I want to do this on a broader scale, but for now focus on metro-Detroit in tabular form. I intend to run correlations when there are enough counties to establish this relationship. I am still very suspect of the data, in this case Monroe County is reporting no deaths but this is likely a statistical improbability based on the number of confirmed cases. 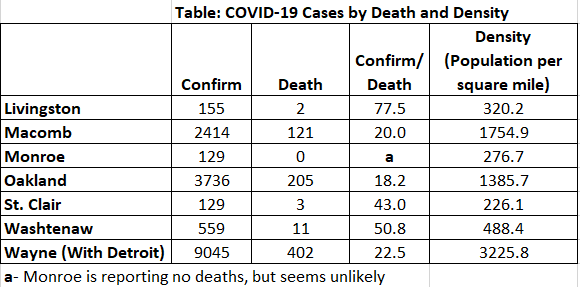 In the table above, from April 7th, we see that the number of confirmed cases that result in death varies considerably (18.2 to 77.5); however, there clearly seems to be a relationship between this proportion and population density. Yet, we also know that density is associated with many other demographic factors and to appropriately analyze these relationships we need a larger data set and to control for many other factors. This will form the basis of future analyses.
0 Comments
Leave a Reply. |
Eric StokanI am an assistant professor of political science at the University of Maryland Baltimore County (UMBC). I completed my Ph.D. in Public Policy and Public Administration at George Washington University. Archives
February 2022
Categories |
 RSS Feed