|
If you saw my previous post on state per capita confirmed rates of coronavirus over time, you may have had some additional questions. This is particularly important, especially regarding confirmed cases by the number tested (Thanks to Thomas Schaller for clearly pointing this out). I start by dispalying the updated totals in Figure 1. NY is still removed from this particular table, because it mitigates the effect of many others- this will likely change as the pace of this increases by state sadly. 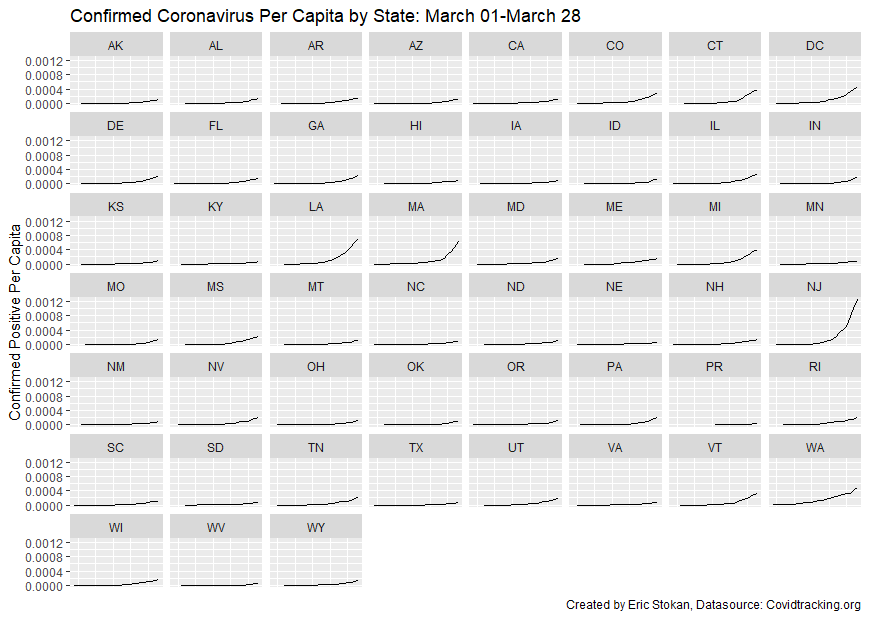 Next, I look at the percentage of those individuals tested who do not have Coronavirus. A couple things to note, there may be double counting which is a concern. Some individuals are testing themselves multiple times and some may have an immunity. There may also be many more who would be negative were they able to get tested. Ideally, we would all get tested right now and strictly quarantine based on the results. This would limit the spread and allow others to get back to work and ensure the sick have the time to recover while the healthy and immune could return to work- particularly in ways to assist the rest of society get through this. States may be hesitant to report negative cases because there is fear that individuals may take it less seriously in that event. I think more information is better than less and note some of the caveats above. Testing data is important as is making it public so we can better understand this. Thus, I report the percentage negative relative to positive and negative cases. 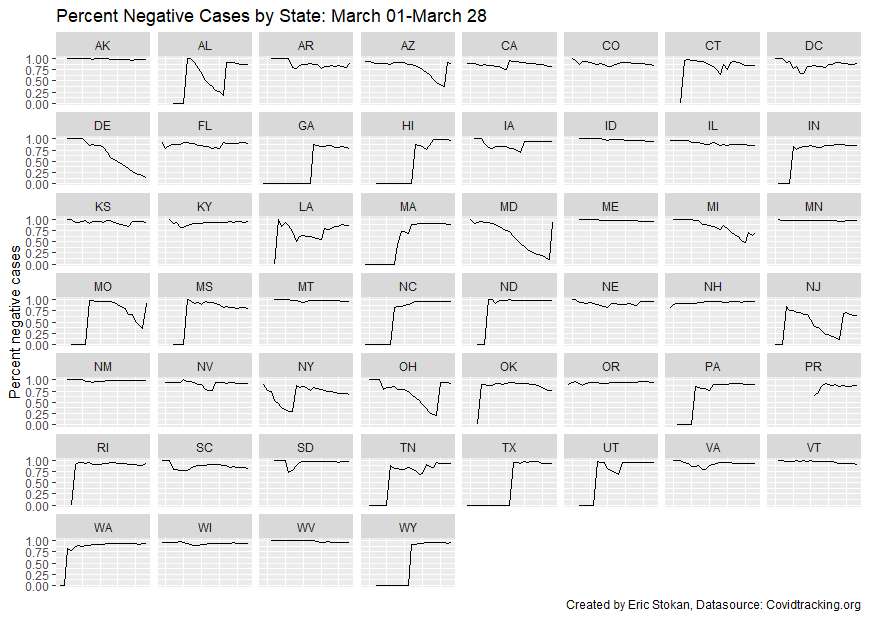 Because of the many discontinuities, it is clear that in many cases the state was not reporting the negative cases early on. So, I truncate the sample to dates from March 20th-28th when data becomes more reliable. 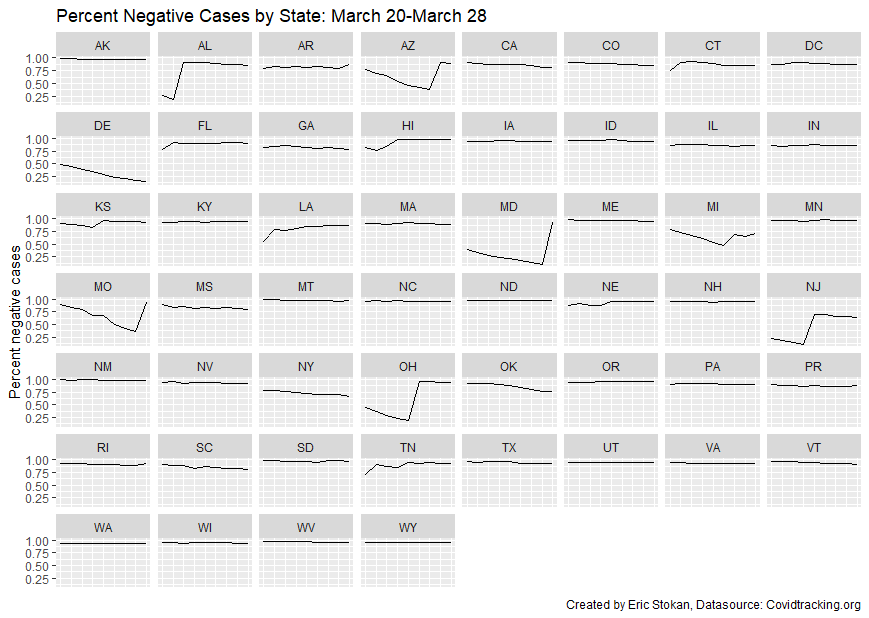 On average, as of March 28th, the percentage of cases that were negative was 88%. That means, so far 12% of those that have gotten tested were confirmed as infected. This is not overly meaningful given that some people will be tested more than once and many others will be more apt to get tested given the concern around COVID-19; however, testing rates by state on per capita terms is important as is the number of confirmed with hospitalization rates- so check this out in a future post.
1 Comment
|
Eric StokanI am an assistant professor of political science at the University of Maryland Baltimore County (UMBC). I completed my Ph.D. in Public Policy and Public Administration at George Washington University. Archives
February 2022
Categories |
 RSS Feed