|
You will notice that most of the charts I have produced rely on a linear scale; however, some like @JamieFlournoy suggested that displaying it this way is problematic as using a log scale should be better. This has recently been elaborated upon by Sevi et al. (Forthcoming) in the Canadian Journal of Political Science (Manuscript here). So, I decided to just quickly display both types of plots here as the Sevi et al. article makes clear that we perceive these very different despite them providing the exact same information simply scaled differently. As a note, the red line represents when MI put their "stay at home order" in place. Going forward, I will be analyzing state policies to determine how policy responses have impacted important COVID-19 related outcome measures. 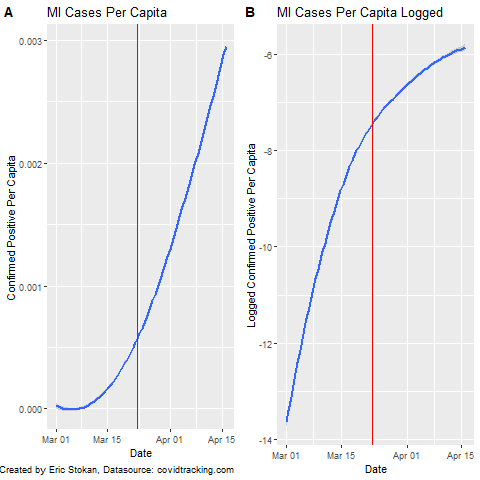 Because expressing these data in per capita terms provides a scale that is not as easily interpretable, I also provide the number of daily cases (new) in MI and the logged number of new cases. In actuality, we know that testing rates in MI are quite low right now relatively speaking - even the death toll is undercounted. These different charts are simply meant to show how important the scale is when interpreting what the data display. We need to be even more careful regarding how we interpret the data and the limitations that exist. 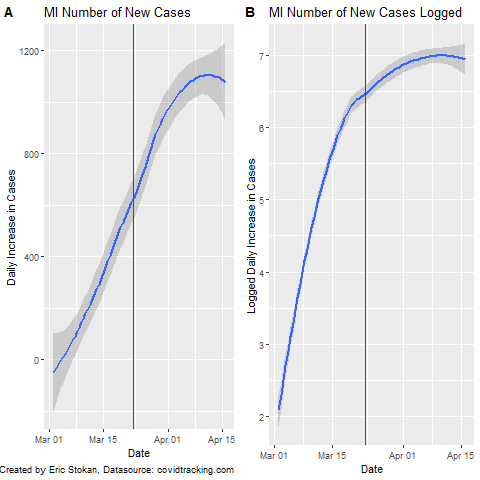
0 Comments
Leave a Reply. |
Eric StokanI am an assistant professor of political science at the University of Maryland Baltimore County (UMBC). I completed my Ph.D. in Public Policy and Public Administration at George Washington University. Archives
February 2022
Categories |
 RSS Feed