|
So, many of you have asked why I excluded NY from the early trajectory rates of COVID-19 infections. I did it because everything is scaled at the same rate for a cross-state comparison. I took care to standardize by population, but still the growth rate in NY has been such that it has so vastly outpaced other states that it makes the situation in each other state not look dire or like the rates are staying flat. They are not, NY is experiencing this earlier and much more rapidly given it's connections to the world economy, as well as the sheer density in the NYC region. While that combination can be great for an economy during good times, it can wreak havoc during a global pandemic. So, to provide you with the info you want here you go. I will first present without NY and the follow it with NY rates through March 28th. One note, the trajectories look roughly the same but the scale has changed. It is still a fraction of a percent of the population in states; however, the rate by which that is increasing is what should be concerning. 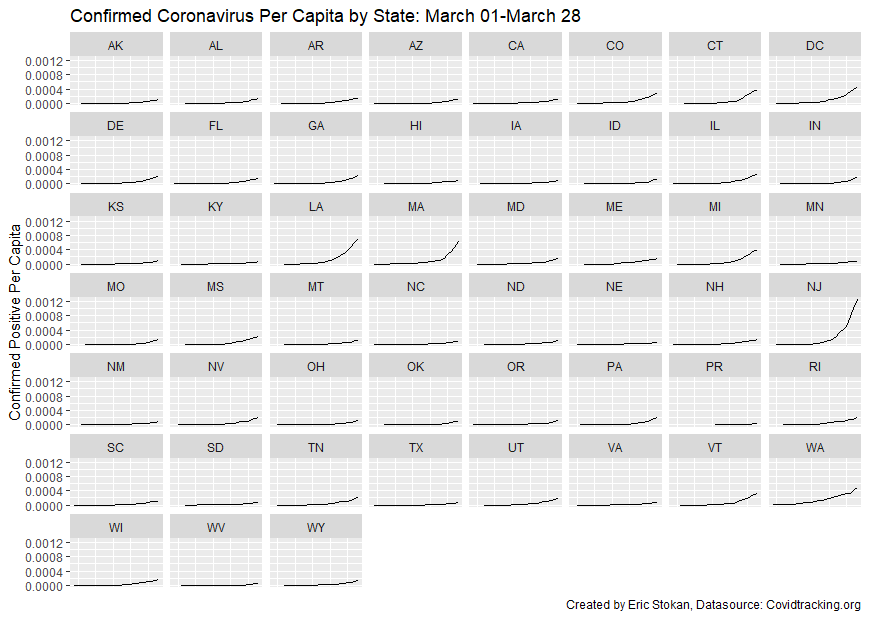 Now, I am taking all of the same data, but adding in NY. Here is the updated figure: 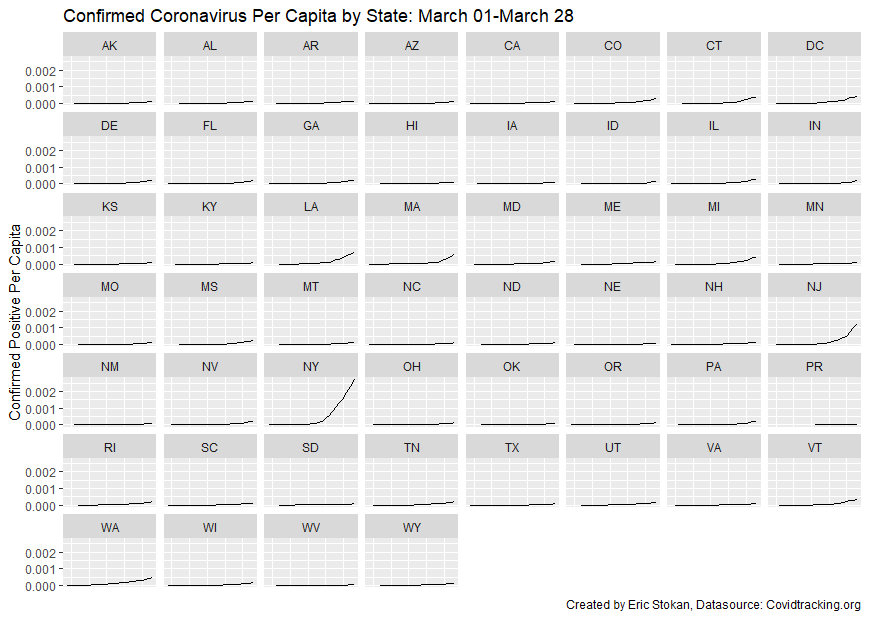
0 Comments
Leave a Reply. |
Eric StokanI am an assistant professor of political science at the University of Maryland Baltimore County (UMBC). I completed my Ph.D. in Public Policy and Public Administration at George Washington University. Archives
February 2022
Categories |
 RSS Feed